Azure Monitor Dynamic Thresholds: What Changes and When to Adopt
Dynamic Thresholds 기능 변화와 도입 시점을 분석합니다.
Dynamic Thresholds replace a single manually chosen alert value with a machine-learned allowed range that adapts to each metric's own history. This brief summarizes what the feature does, how long it takes to become useful, and how to move from static rules to dynamic ones without losing existing safety guarantees.
Preview chart
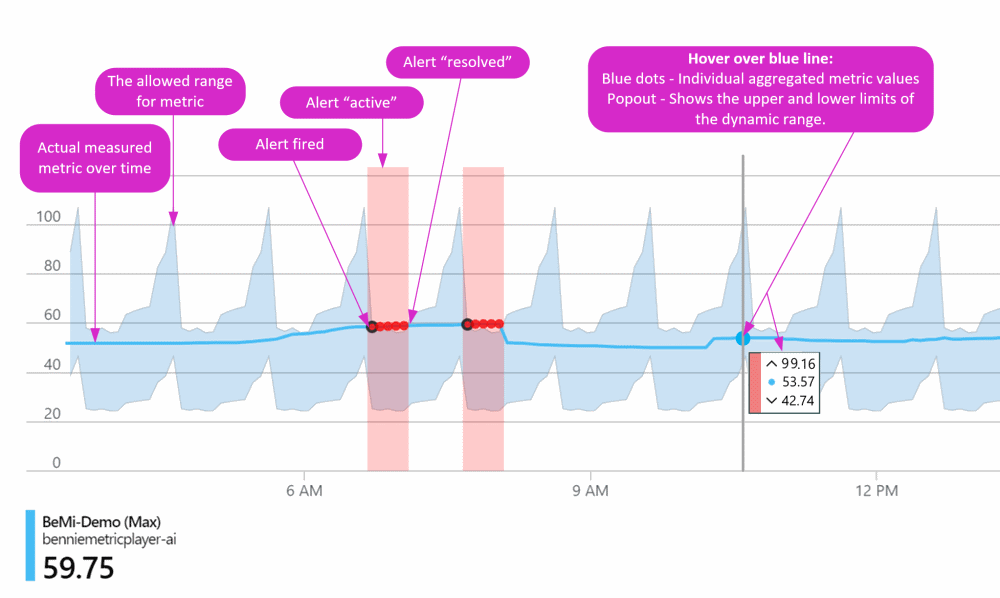
Source: Create a Log Search alert rule with dynamic threshold.
What changes
With a static rule, an operator picks one fixed number (or one KQL threshold) and every evaluation is compared against it. With Dynamic Thresholds, the rule instead learns an upper and lower allowed range from the metric's own recent behavior — hourly, daily, and (after enough history) weekly patterns — and fires only when a value falls outside that learned range. No one has to guess the "right" number per metric, per resource, or per dimension up front.
How the model becomes useful
Dynamic Thresholds do not become trustworthy immediately. The timeline below comes directly from Microsoft's documented behavior:
- Last 10 days of historical data are used for the initial threshold calculation when a rule is created, and the same 10-day window is what the preview chart reflects.
- No alert fires before 3 days and 30 samples of data have been collected — new resources or resources missing data simply don't trigger until enough history exists.
- At least 3 weeks of historical data are needed before the model can detect weekly seasonality and adjust its bounds accordingly.
- Ongoing learning uses all available historical data to improve accuracy. Recent behavior changes are not reflected immediately; Microsoft notes that the upper and lower bounds consider metric data from the last 10 days.
Static versus dynamic: when to use each
| Use static thresholds for | Use dynamic thresholds for |
|---|---|
| Hard limits that must never be crossed (capacity ceilings, contractual SLAs, safety boundaries) | Sudden deviations from a metric's normal behavior |
| Cold-start scenarios with no history to learn from | Metrics whose "normal" range legitimately shifts over time |
| Deterministic testing, where a known fault must reliably trigger the same alert | Metrics with daily or weekly seasonality (traffic, usage patterns) |
| Slow, gradual degradation that a fixed ceiling still catches | Many resources or dimensions, where hand-tuning one threshold per series doesn't scale |
Alert paths that support dynamic thresholds
| Alert type | What it evaluates | Notes |
|---|---|---|
| Metric alerts | Most Azure Monitor platform and custom metrics | Some metrics are excluded — see the unsupported metrics list |
| Log Search alerts | A numeric KQL query result | Minimum 5-minute evaluation frequency; 1-minute frequency is not supported |
| PromQL query-based metric alerts | A numeric PromQL expression over Prometheus or OTel metrics | Currently in Preview; works best with expressions that resolve to numeric values rather than Boolean comparisons |
Safe adoption flow
- Start with Medium or Low sensitivity to reduce alert noise before tightening.
- Use Preview Chart to inspect the learned allowed range against real history before enabling the rule.
- Create the dynamic condition in shadow mode — no Action Group attached — so it can be observed without paging anyone.
- Observe for at least 3 days and 30 samples, and for 3 weeks when weekly seasonality matters to the workload, before drawing conclusions.
- Compare the dynamic rule's false positives and false negatives against the existing static rule over that observation window.
- Once quality is acceptable, attach the Action Group to the dynamic rule — while keeping the static hard-limit rules in place for the failure modes they still catch better (cold start, deterministic tests, absolute ceilings).
Boundaries to keep in mind
- Cold start: a new metric series has no history, so no dynamic threshold can fire until enough data accumulates.
- Slow drift: dynamic thresholds are tuned for significant deviations, not slowly evolving degradation — a gradual decline can quietly become the new "normal."
- One dynamic condition per rule: a rule that uses dynamic thresholds cannot monitor multiple conditions.
- Unsupported metrics: a fixed set of platform metrics cannot use dynamic thresholds at all — check the unsupported metrics list before adopting.
- Unpublished sensitivity formula: Microsoft does not publish the exact algorithm behind the Low/Medium/High sensitivity settings — treat them as tuning levers to evaluate empirically, not as a documented formula.