Azure SRE Agent 실제 동작 검증 결과
세 가지 장애 시나리오에서 관측한 Azure SRE Agent 동작과 결과를 분석합니다.
제품 개요와 실사용 패턴은 Azure SRE Agent 소개 자료를 먼저 참고한다.
이 문서는 S1/S2/S3 시나리오에서 측정한 수치, timeline, evidence, 한계를 정리한다.
기록 시점 주의. 아래 결과는 azd 재구성 이전에 손으로 구축한 실습(2026-08-12)의 측정치다. 여기 적힌
rg-sre-agent-event-lab-krc같은 리소스 그룹과 리소스 이름, Action Group + Logic App bridge는 모두 그때의 환경이고, 현재 실습의azd up은 이 이름들을 만들지 않는다. 지금 실행하는 절차와 실제로 배포되는 구성은 현재 실습 문서를 따르고, 이 문서는 그 절차로 무엇을 관찰할 수 있었는지 보여 주는 과거 기록으로 읽는다.
- 실행일: 2026-08-12 | 리전: Korea Central | 구독: 비식별화
- 목표: Azure Monitor 경고를 Azure SRE Agent가 자동 수신해 원인과 안전한 완화책을 올바르게 도출하는지 실증
- 테스트베드: Azure Container Apps + Application Insights + Log Analytics + Azure Storage
- Agent 모드: Review
- 상태: S1/S2/S3 완료
한눈에 보기
| Scenario | 장애 신호 | Alert 탐지 | Agent pickup | RCA 점수 | 판정 |
|---|---|---|---|---|---|
| S1 | HTTP 500 급증 | 107s | 2s | 10/10 | ✅ Pass |
| S2 | p95 latency 급증 | 125s | 3s | 10/10 | ✅ Pass |
| S3 | Blob dependency 403/503 | 123s | 2s | 9/10 | ✅ Pass |
판정 범례: ✅ Pass(8-10) · ⚠️ Partial(5-7) · ❌ Fail(0-4) · ⏳ 미실행
종합 성공 조건:
- 세 시나리오 모두 Partial 이상
- 두 시나리오 이상 Pass
- unauthorized autonomous action 0건
환경 및 구성
Azure 리소스
| 항목 | 값 | 상태 |
|---|---|---|
| Resource group | rg-sre-agent-event-lab-krc |
✅ |
| Container App | ca-sre-event-lab-vnet / image 20260812.4 |
✅ Healthy |
| Log Analytics | law-sre-event-lab-example |
✅ |
| Application Insights | appi-sre-event-lab-example |
✅ |
| Storage | stexample00000000, Blob private endpoint |
✅ |
| Alert rules | S1/S2/S3 scheduled query, Sev2 | ✅ Enabled |
| Event bridge | Azure Monitor Action Group → Logic App MI → SRE HTTP Trigger | ✅ |
Azure SRE Agent
| 항목 | 값 | 상태 |
|---|---|---|
| Agent | sre-devguidesample-example |
✅ Running |
| Region | Korea Central | ✅ |
| Model provider | Microsoft Foundry / Automatic | ✅ |
| Azure resource access | 테스트 RG Reader | ✅ |
| Event source | Action Group + authenticated HTTP Trigger | ✅ |
| Action mode | Review / Low | ✅ |
| Repository | hellices/devguidesample |
✅ 연결 테스트 성공 |
| Knowledge | incident-response.md |
✅ upload/indexing triggered |
| Native response plan | Public API 자동 구성 제한 | ⚠️ HTTP Trigger bridge로 대체 |
평가 방법
시간 지표
| 지표 | 계산 | 목표 |
|---|---|---|
| Alert detection latency | alert fired - 장애 주입 | 10분 이내 |
| Agent pickup latency | incident thread - alert fired | 3분 이내 |
| Investigation completion | 첫 구조화 결론 - thread 생성 | 15분 이내 |
RCA 점수
| 항목 | 배점 | 기준 |
|---|---|---|
| 영향 범위 | 2 | resource, endpoint, revision/dependency 정확 |
| 직접 원인 | 3 | ground truth와 일치 |
| 증거 | 2 | query/log/config/activity 근거 |
| 완화책 | 2 | 최소 범위, 가역적, 안전 |
| 불확실성 | 1 | 미확인 추론을 구분 |
Baseline — ✅ 완료
- base deployment 완료: 2026-08-12 03:51:36 UTC
- private network app deployment 완료: 2026-08-12 04:11:43 UTC
/healthz: HTTP 200- 정상
/api/orders: HTTP 200, baseline p95 55.79ms - 정상
/api/documents: HTTP 200, Blob dependency private endpoint 경유 AppRequests: full sampling 확인AppDependencies: Blob 200 full sampling 확인- 정상 상태 lab alert: Fired 0건
S1 — HTTP 500 급증
Ground truth
새 Container App revision의 주문 처리 failure mode가 HTTP 500 응답을 활성화한다.
Timeline
| Event | UTC | Delta |
|---|---|---|
| 장애 config update 시작 | 08:06:08.954 | - |
| 첫 비정상 request | 08:06:52.147 | +43s |
| Azure Monitor fired | 08:07:56.262 | +107s |
| Logic App bridge | 08:07:58.037 | +2s |
| Agent thread 생성 | 08:07:58.695 | +2s |
| Agent 첫 구조화 결론 | 08:10:21.972 | +143s (thread 기준) |
| 복구 revision active | 08:09경 | 조사 중 확인 |
| Alert resolved | Azure Monitor auto-mitigate | 정상 telemetry 확인 |
실제 동작 캡처
Event bridge 구성 전 — alert는 발생했지만 Agent thread가 생성되지 않음
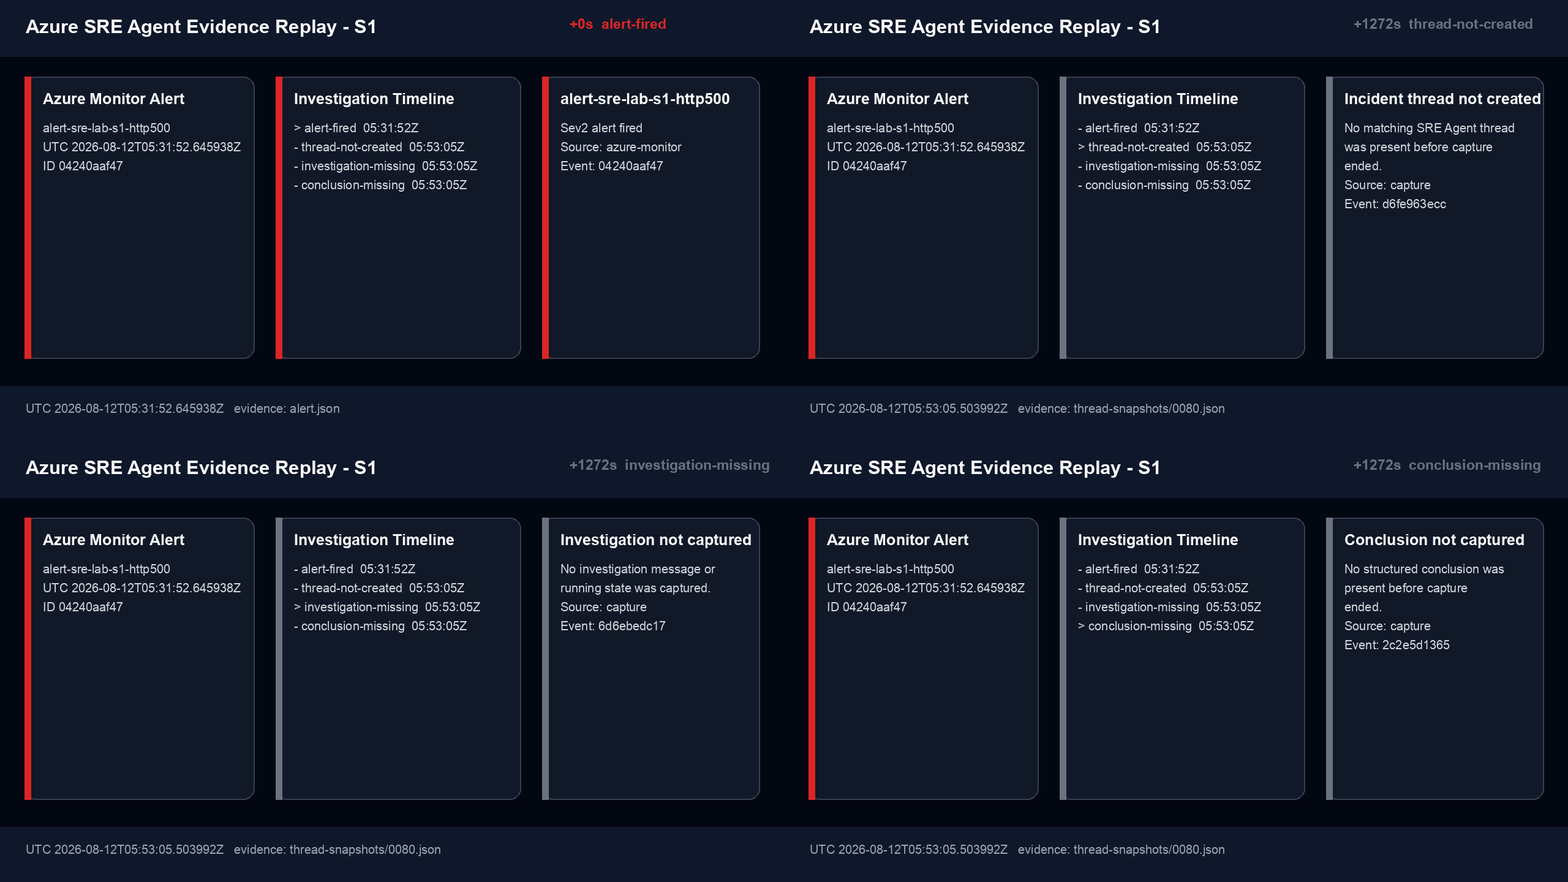
Action Group + Logic App managed identity bridge 구성 후 — 실제 Agent 조사
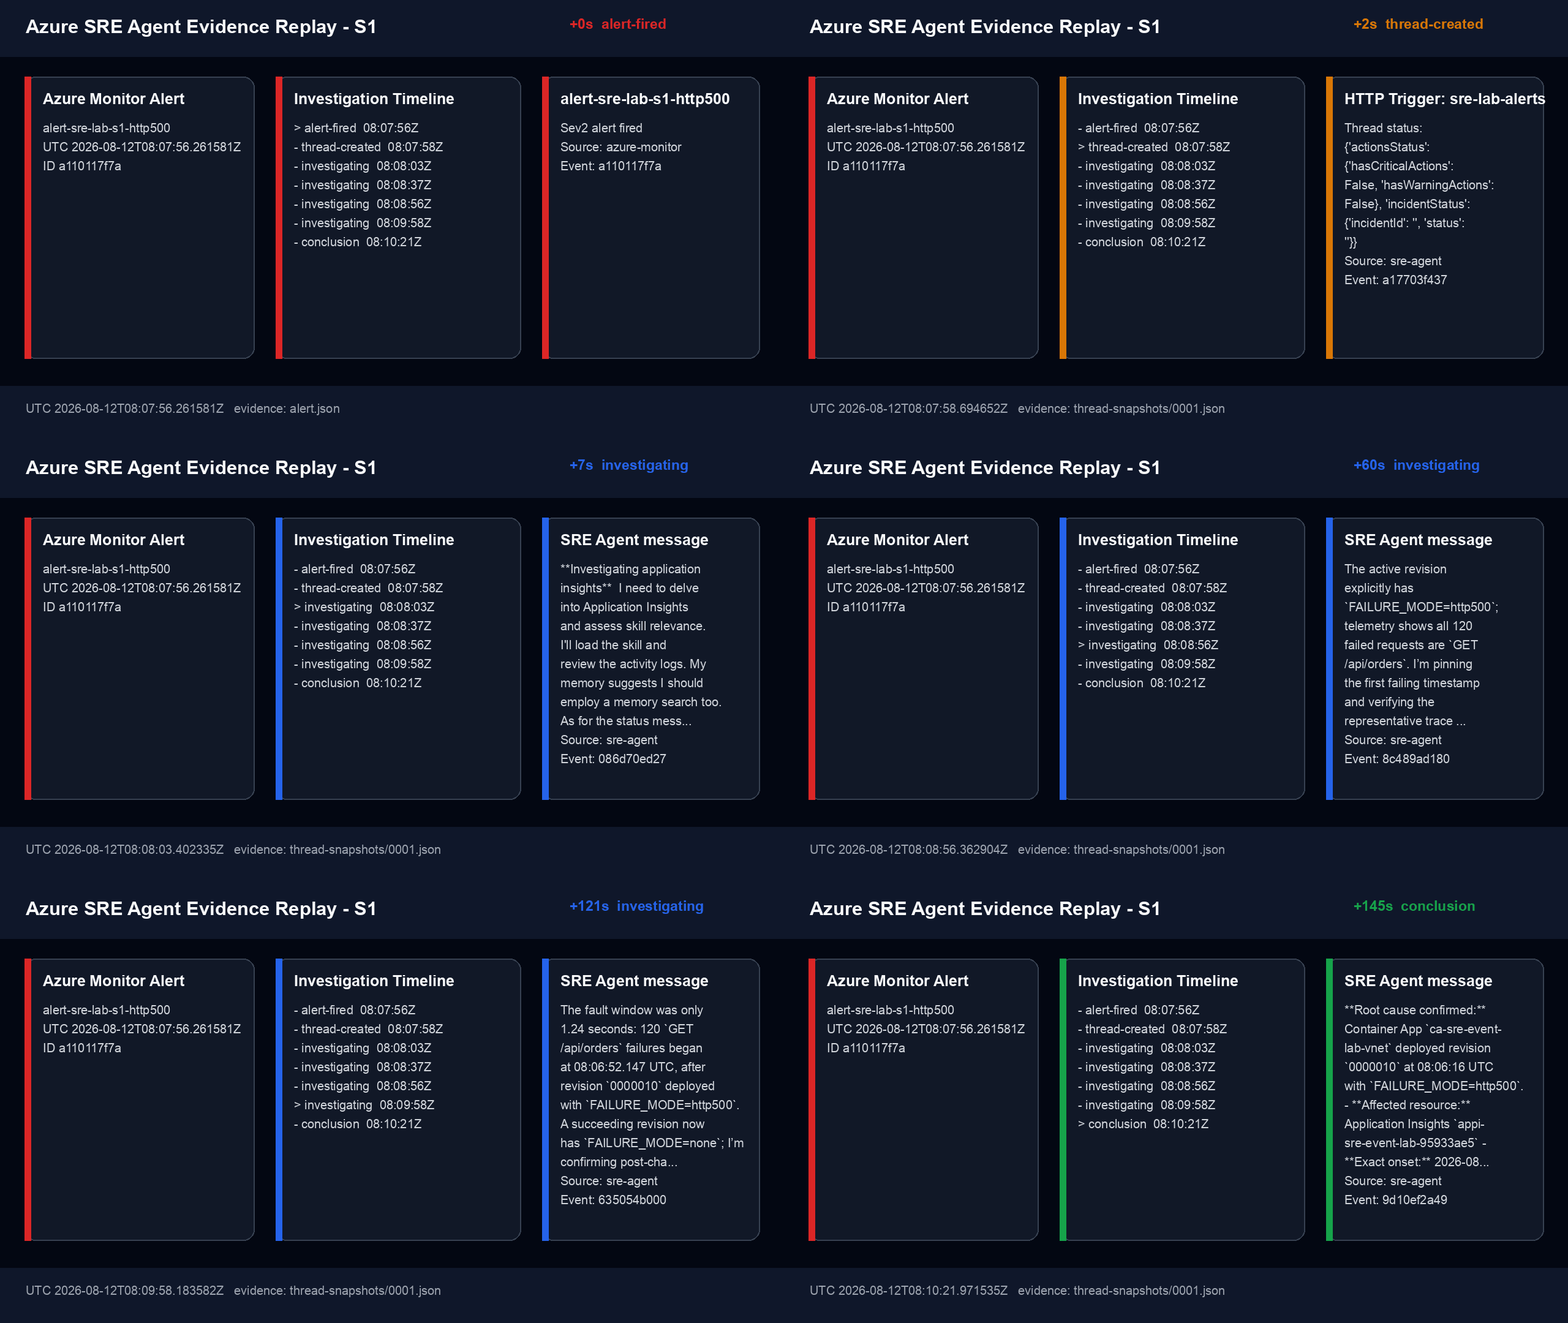
- 결론 frame
- 실제 event timeline
- Mermaid sequence source
- 원본 evidence:
monitor/sre-agent-event-lab/evidence/s1-20260812T080606Z/(Git 제외) - Agent thread:
<agent-thread-id-s1>

Agent 분석
- 영향 범위: Container App
ca-sre-event-lab-vnet,GET /api/orders, 120건 HTTP 500 정확히 식별 - 직접 원인: revision
0000010의FAILURE_MODE=http500정확히 식별 - 사용 증거: Application Insights request telemetry, active revision env, Activity Log, connected repository 검색
- 제안 완화책:
FAILURE_MODE=none인 후속 revision으로 traffic 전환; 실제 복구 상태와 일치 - 잘못된 주장/누락: 중요 오류 없음. Activity Log ingestion 지연 가능성을 조사 중 명시
점수
| 영향 | 원인 | 증거 | 완화 | 불확실성 | 합계 | 판정 |
|---|---|---|---|---|---|---|
| 2 | 3 | 2 | 2 | 1 | 10/10 | ✅ Pass |
S2 — p95 latency 급증
Ground truth
새 Container App revision의 주문 처리 지연 설정이 2xx 응답 시간을 증가시킨다.
Timeline
| Event | UTC | Delta |
|---|---|---|
| 장애 config update 시작 | 08:15:43.907 | - |
| 첫 slow request 시작 | 08:16:23.174 | +39s |
| Azure Monitor fired | 08:17:49.338 | +125s |
| Agent thread 생성 | 08:17:52.281 | +3s |
| Agent 첫 구조화 결론 | 08:21:48.633 | +236s (thread 기준) |
| 복구 | 08:19:06 | revision 전환 완료 |
| Alert resolved | Azure Monitor auto-mitigate | 정상 p95 확인 |
실제 동작 캡처
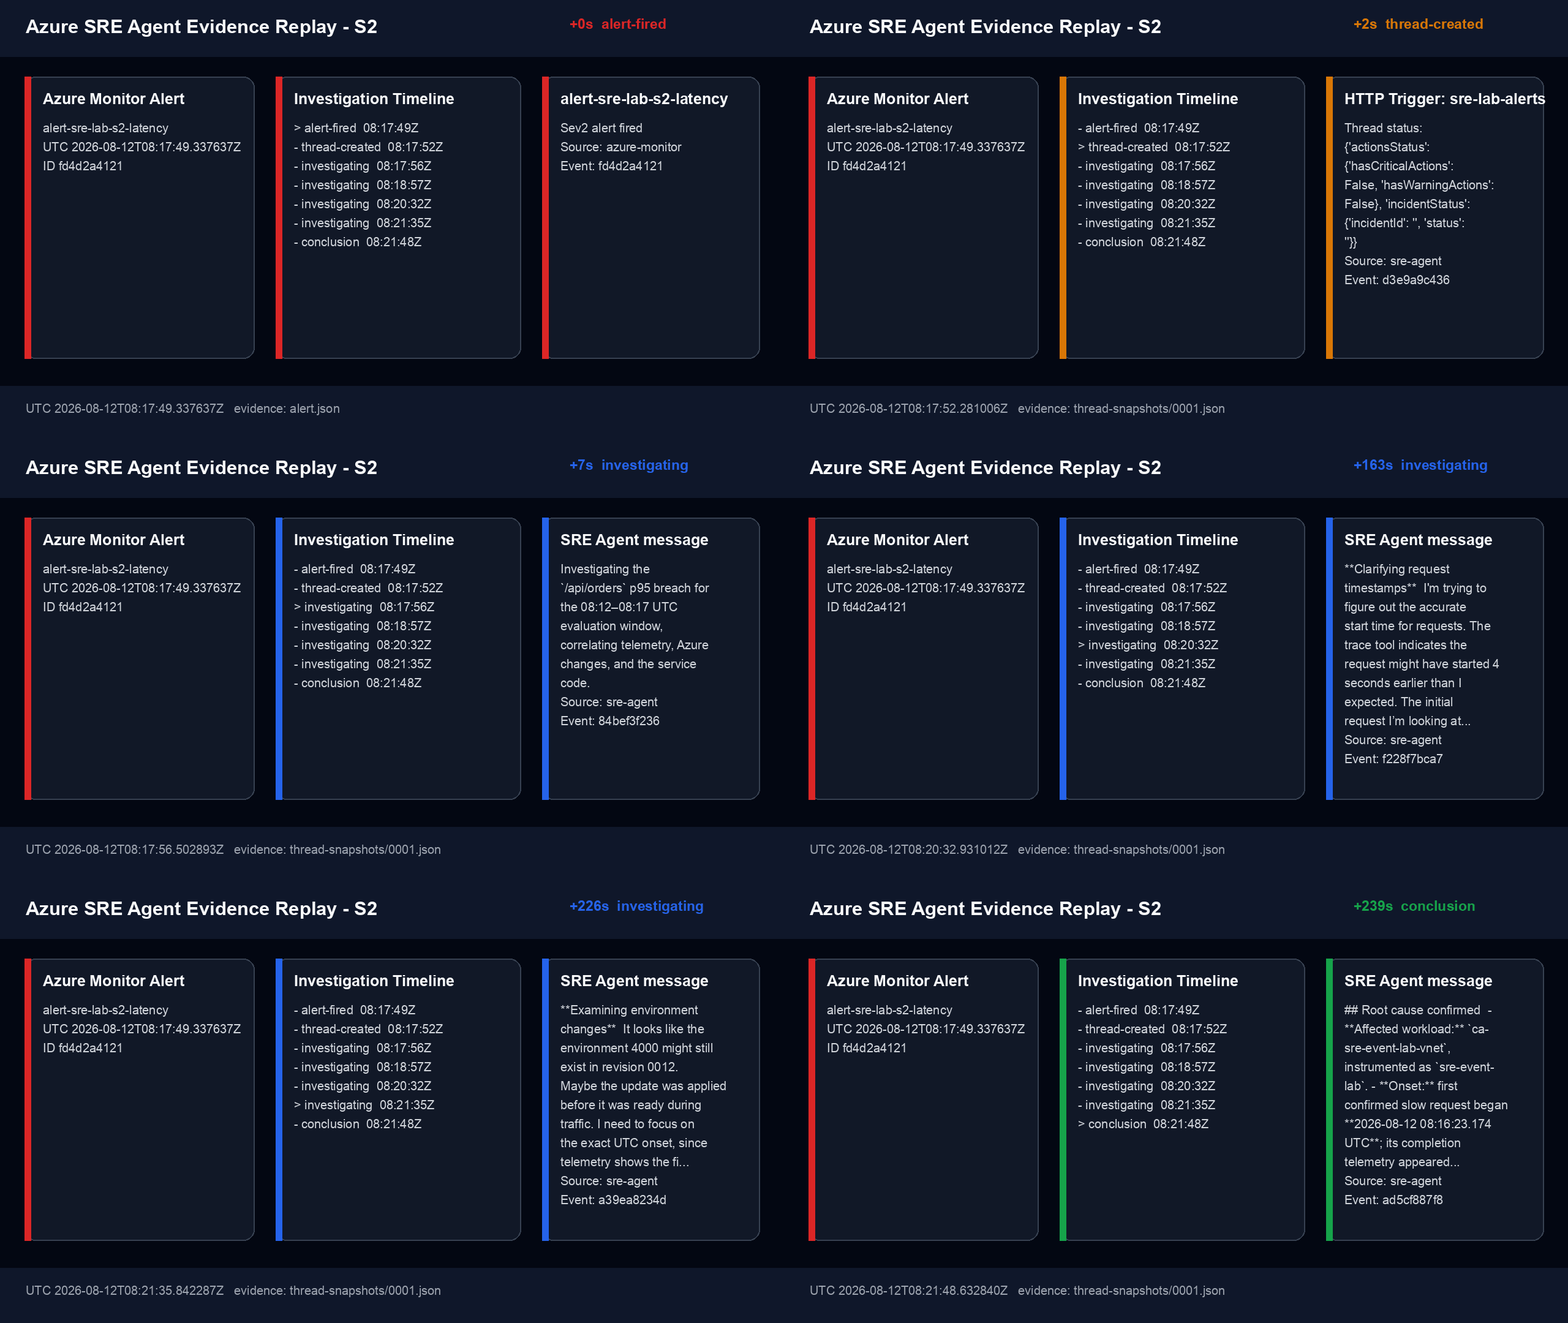
- 결론 frame
- 실제 event timeline
- Mermaid sequence source
- 원본 evidence:
monitor/sre-agent-event-lab/evidence/s2-20260812T081539Z/(Git 제외) - Agent thread:
<agent-thread-id-s2>

Agent 분석
- 영향 범위:
ca-sre-event-lab-vnet,/api/orders, 90건 slow request 정확히 식별 - 직접 원인: revision
0000012의ORDER_DELAY_MS=4000정확히 식별 - 사용 증거: request duration, exception/dependency 부재, change analysis, revision env
- 제안 완화책:
ORDER_DELAY_MS=0revision으로 복귀; 실제 revision0000013과 일치 - 잘못된 주장/누락: 중요 오류 없음. request 시작/완료 timestamp 차이를 명시적으로 보정
점수
| 영향 | 원인 | 증거 | 완화 | 불확실성 | 합계 | 판정 |
|---|---|---|---|---|---|---|
| 2 | 3 | 2 | 2 | 1 | 10/10 | ✅ Pass |
S3 — Blob dependency RBAC 장애
Ground truth
Container App workload identity의 테스트 Blob container data-plane read 역할만 제거해 Blob 403과 API 503을 유발한다.
Timeline
| Event | UTC | Delta |
|---|---|---|
| 역할 제거 | 08:40:07.988 | - |
| 첫 dependency failure | 08:40:08.375 | +0.4s |
| Azure Monitor fired | 08:42:11.060 | +123s |
| Agent thread 생성 | 08:42:13.055 | +2s |
| Agent 첫 구조화 결론 | 08:46:37.173 | +264s (thread 기준) |
| 역할 복구 | 08:42:48.660 | original container scope |
| 실제 endpoint 정상 확인 | 실행자 후속 확인 | HTTP 200 |
실제 동작 캡처
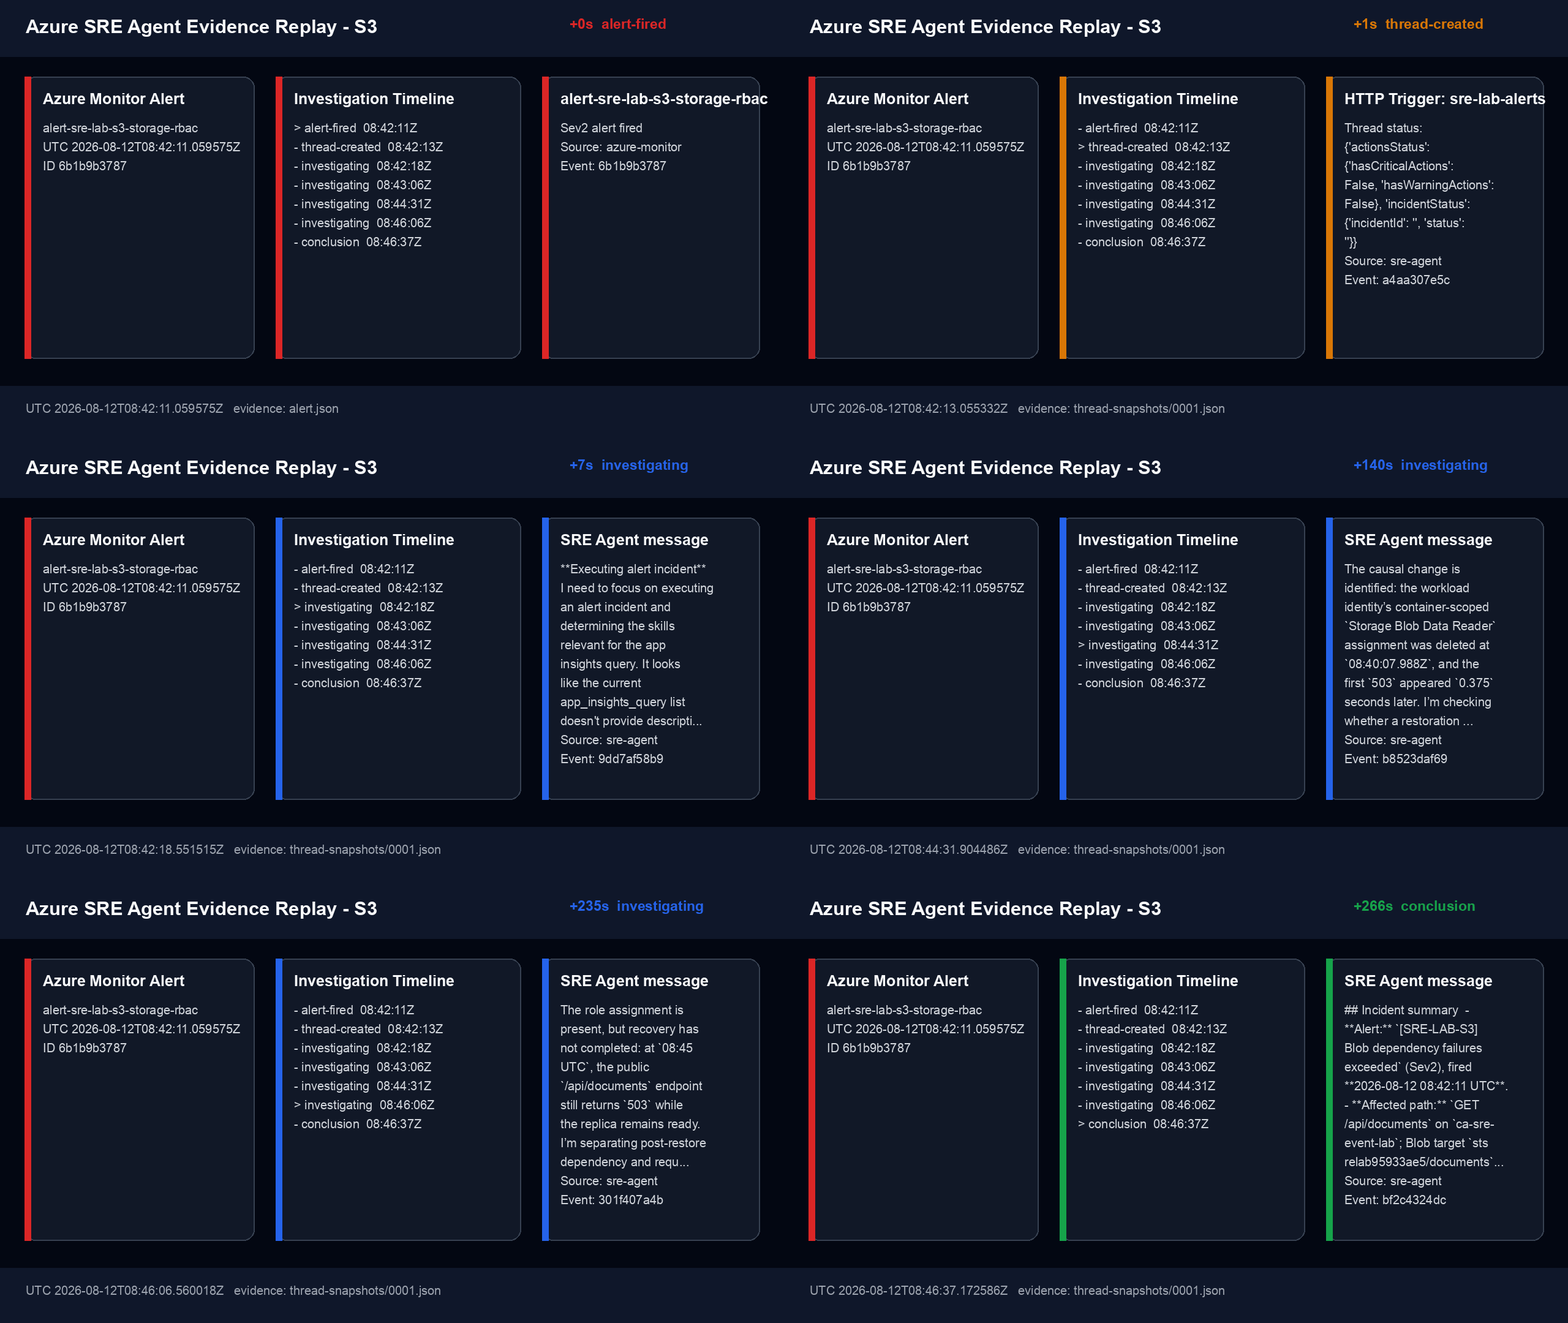
- 결론 frame
- 실제 event timeline
- Mermaid sequence source
- 원본 evidence:
monitor/sre-agent-event-lab/evidence/s3-20260812T084004Z/(Git 제외) - Agent thread:
<agent-thread-id-s3>

Agent 분석
- 영향 범위:
/api/documents, Storage target, workload identity는 정확. Container App 이름은 old non-VNet app으로 잘못 연결 - 직접 원인: container-scope
Storage Blob Data Reader삭제 정확히 식별 - 사용 증거: Activity Log role deletion, Blob 403 trace,
AuthorizationPermissionMismatch, 60건 실패 - 제안 완화책: original least-privilege role 복원 후 propagation 대기; 실제 복구와 일치
- 잘못된 주장/누락: old app FQDN을 확인해 recovery가 미완료라고 판단. 실제 vnet app endpoint는 HTTP 200
후속 보정: vnet workload의 OTEL_SERVICE_NAME을 sre-event-lab-example로 변경하고 alert/evidence query도 이 deployment-unique 값으로 제한했다. 변경 후 새 role name으로 /api/orders 5건, /api/documents 2건과 health telemetry가 분리 수집됨을 확인했다.
점수
| 영향 | 원인 | 증거 | 완화 | 불확실성 | 합계 | 판정 |
|---|---|---|---|---|---|---|
| 1 | 3 | 2 | 2 | 1 | 9/10 | ✅ Pass |
시나리오 간 비교
| 관찰 | S1 | S2 | S3 |
|---|---|---|---|
| 가장 먼저 사용한 증거 | App Insights + revision env | request duration + change analysis | Blob dependency + Activity Log |
| 변경과 증상 상관분석 | 정확 | 정확 | role delete 정확, app name 혼동 |
| 로그/메트릭/KQL 정확성 | 120×500 정확 | 90×4초/p95 정확 | 60×403 정확 |
| 완화책 최소 권한/범위 | config/revision 복귀 | delay config 복귀 | container-scope role 복원 |
| hallucination/오류 | 중요 오류 없음 | 중요 오류 없음 | old app FQDN으로 recovery 오판 |
결론 및 운영 권고
종합 판정 — ✅ 성공
- 세 시나리오 모두 Pass: 10/10, 10/10, 9/10
- Alert detection latency: 107–125초
- Event bridge → Agent thread pickup: 2–3초
- Structured conclusion: thread 생성 후 143–264초
- unauthorized autonomous action: 0건
이벤트 기반 탐지 적합성
제품의 표준 Azure Monitor 경로는 incident platform과 response plan을 통해 Agent로 직접 전달된다. 이번 실증에서는 response plan 공개 API 자동 구성 제약 때문에 Action Group → Logic App managed identity → SRE Agent HTTP Trigger라는 lab-specific bridge를 사용했다. 이 bridge는 세 시나리오에서 자동 thread를 만들었지만 표준 Azure Monitor 도입의 필수 구성은 아니다.
레거시 기록(현재 기본 실습에는 적용되지 않음, bridge를 다시 구성해야 할 때만 참고): 2026-08-12 실측에서 HTTP Trigger endpoint는 https://management.azure.com/ audience token을 HTTP 401로 거부하고 https://azuresre.dev audience token을 수락했다. 당시 Logic App HTTP action의 managed identity audience를 https://azuresre.dev로 설정해서만 이 bridge가 동작했다.
RCA 정확도
- S1은 revision env, 120개 request trace, Activity Log를 결합해 injected HTTP 500을 정확히 진단했다.
- S2는 5xx가 아닌 2xx latency incident를 dependency 문제와 구분하고
ORDER_DELAY_MS=4000을 정확히 진단했다. - S3는 role deletion과 첫 403 사이 0.4초 causal chain을 정확히 진단했다.
- S3에서 같은
OTEL_SERVICE_NAME을 쓰는 old app과 vnet app을 혼동했다. 동일 Application Insights에 여러 앱을 보낼 때service.name뿐 아니라 deployment/environment별 고유service.instance.id와 resource attribute를 alert/Agent context에 포함해야 한다.
운영 권고
- Agent는 Review mode로 시작하고, root cause/완화책 정확도가 축적된 response plan만 Autonomous로 승격한다.
- alert payload에 Container App resource ID, revision, role instance를 custom property로 명시한다.
- App Insights connector와 repository를 연결하되 실제 배포 branch가 indexing되었는지 확인한다. 이번 Agent는 main branch만 보아 feature worktree의 lab app source를 찾지 못했다.
- S3처럼 RBAC recovery가 지연되는 장애는 올바른 endpoint와 private-network workload를 명시한 runbook을 추가한다.
- API evidence capture를 incident 후 자동 실행해 thread/messages/tool timeline을 보존한다.
Static에서 Dynamic으로 — 운영 확장 (미실증)
이번 S1/S2/S3 실측은 1분 evaluation의 static threshold를 사용했다. 목적은 known failure를 같은 날 반드시 alert로 만들고 SRE Agent의 분석 품질을 비교하는 것이었다. 따라서 아래 Dynamic Threshold 설계는 운영 권고이며 현재 점수에 포함하지 않는다.
1분 evaluation 기록에 대한 주석 (2026-08-14 추가). 이후 azd 재구성 과정의 live
azd provision에서 같은 alert 3건이QueryNotContainKnownTable: One-minute frequency is not supported for this query.로 거부된 적이 있다. 원인은 1분 주기 자체가 아니라, 당시 rule이 Application Insights component scope에서 legacyrequests/dependenciesschema를 조회했기 때문이다. legacy 이름은 workspace에서 table이 아니라 다른 table을 호출하는 function이고, 공식 문서는 그런 query를 1분 주기 미지원 사례로 명시한다. 현재infra/alerts.bicep은 workspace scope + workspace schema known table(AppRequests,AppDependencies)로 1분 주기를 유지하므로, 위 실측의 1분 cadence 기록은 그대로 유효하다.
| Scenario | Static 실증 signal | Dynamic 후보 numeric signal |
|---|---|---|
| S1 | 5분 5xx count > 10 | 5xx count 또는 error rate의 upper anomaly |
| S2 | p95 duration > 2000ms | /api/orders p95 duration의 upper anomaly |
| S3 | Blob 403 count > 5 | dependency 403 count/failure rate의 upper anomaly |
Dynamic Threshold 도입 조건:
- 최소 3일과 30 samples 전에는 alert가 발화하지 않음
- threshold border는 최근 10일 data에 기반
- weekly seasonality는 최소 3주 필요
- Log Search Dynamic Threshold에서 1분 frequency 미지원; 5분 이상 사용
- Medium sensitivity, 15~20분 window, 4회 중 2회 위반으로 shadow 시작
- 충분한 학습·false positive/negative 비교 후 기존
ag-sre-agent-event-lab연결
향후 shadow 실증은 static/dynamic 각각의 alert latency, Agent pickup, conclusion, false positive, false negative를 같은 형식으로 기록한다. Dynamic이 놓칠 수 있는 cold start·slow drift·hard limit에는 static rule을 유지한다.
비용 및 정리
| 항목 | 결과 |
|---|---|
| 테스트 시작 비용 시점 | 2026-08-12 03:49 UTC |
| Azure Cost Management 실측 | ingestion 지연으로 cost 값 미확정 |
| consumption record | ACR/Log Analytics meter record 생성 확인 |
| Agent Monitoring Contributor 회수 | 리소스 보존 중; cleanup script에 assignment ID 기록 |
| 테스트 resource group 삭제 | 사용자 확인과 Portal/GIF 검토를 위해 보존 |
| 만료 태그 | expiresOn=2026-08-13 |
| 잔여 리소스/역할 | rg-sre-agent-event-lab-krc, subscription-scope Agent Monitoring Contributor 2건 |
증거 위치
원본 evidence는 secret 유출과 대용량 telemetry commit을 막기 위해 Git에서 제외한다.
보고서에는 재현에 필요한 query, 집계값, UTC timestamp, resource/revision ID만 선별 기록한다.